
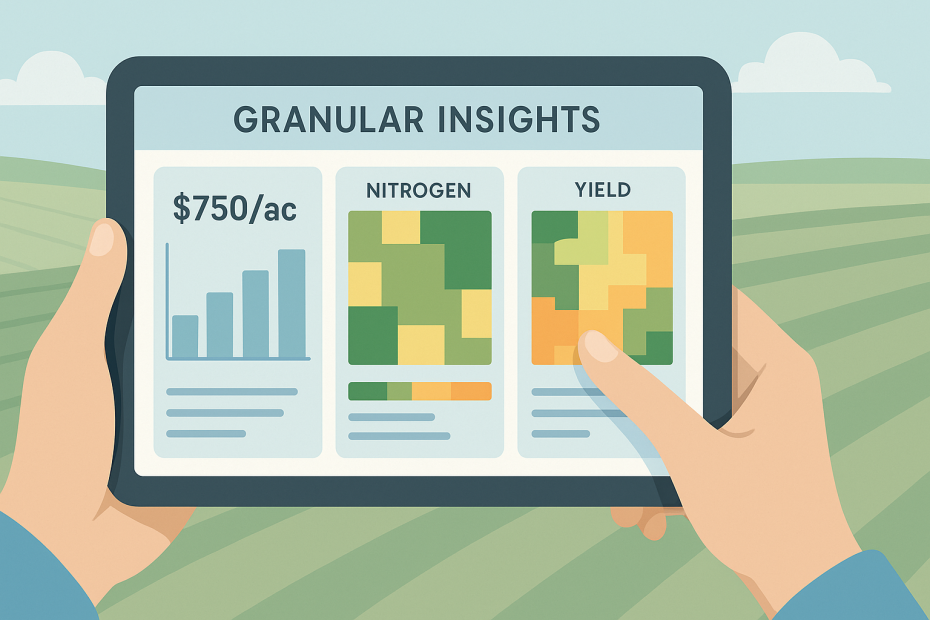
Granular Insights helps you increase farm profitability by centralizing field plans, cost tracking, and yield analysis—so every decision aligns with your financial and agronomic goals.
By using Granular, you turn scattered farm data into actionable insights. This article explains how to use the software to track field-level profitability, optimize inputs, manage nitrogen, and plan crops with clarity. Expect practical steps, real-world applications, and decision-driven guidance.
What is Granular Insights and how does it help farmers?
Granular Insights is a digital farm management platform that organizes your operations, financials, and agronomic data into one system. It gives you visibility on where your farm makes or loses money.
You connect data directly from John Deere Operations Center, Case IH AFS Connect, or Ag Leader, so you don’t waste time entering details manually. The platform then calculates profit at the field or hybrid level.
With those insights, you plan smarter. You allocate seed and fertilizer budgets to the most profitable acres, while reducing risk on lower-potential zones.
How do I track field-level profitability with Granular?
Profitability tracking is one of Granular’s most powerful functions. Instead of waiting until tax season or using spreadsheets, you see near real-time field-level profit and loss.
The system compiles yield data, input costs, and grain prices to create instant per-acre profit estimates. Farmers using Granular have noted that the software flagged fields that looked strong in bushels but lost margin due to higher-than-expected input costs.
That transparency helps you cut unproductive practices early. You can redirect seed, nitrogen, or crop protection resources toward the fields or hybrids delivering the best returns.
Which crops does Granular support and how do I enter planning data?
Granular supports most major row crops—corn, soybeans, wheat, canola, cotton, sorghum, and sunflower—plus forage crops like alfalfa. You can upload machine data automatically or enter planting and treatment plans manually.
When building a plan, you specify seed variety, planting rate, and crop protection strategy at the field level. Those inputs align with your cost structure and revenue goals.
For corn and soybeans, you can also generate variable-rate seeding plans. The system integrates your yield maps and profitability reports, making sure seed investment scales to yield potential.
How can I use imagery, notes, and yield estimators in Granular?
Granular leverages satellite imagery and scouting tools to keep you ahead of issues. You can monitor plant health across fields, mark notes on maps, and upload geotagged photos.
The imagery highlights stress zones, letting you spot nutrient deficiencies, water issues, or pest outbreaks before they spread. Those observations feed into your profitability dashboard—connecting agronomy with economics.
Yield estimators further enhance planning. Instead of waiting until harvest, you get early projections. That allows you to adjust inputs mid-season, lock in sales contracts, or prepare logistics with confidence.
What does Granular Insights offer for managing nitrogen inputs?
Nitrogen is often your largest variable expense, and Granular helps you manage it precisely. Its Nitrogen Essentials feature uses soil models, weather data, and crop simulations to guide application timing and rates.
You can see real-time nitrogen availability across fields, then decide whether to top-dress, side-dress, or skip an application. This avoids costly overuse while protecting yield.
For high-value acres, the software crunches hundreds of simulations per field daily. That predictive intelligence gives you recommendations that balance cost control with crop performance.
How do teams and advisors collaborate in Granular?
Granular is not just for owners—it connects your agronomists, managers, and operators. You can assign roles, share profitability dashboards, and keep everyone on the same page.
Field notes and treatment plans are visible across devices. If a scout flags a nitrogen deficiency, both the farm manager and agronomist can view the same imagery and cost impact.
That collaboration eliminates silos. Instead of separate conversations, you build a single record of operations, costs, and outcomes that supports consistent decision-making.
What You Get with Granular
- Create crop plans with field-level seeding and protection details.
- Track profitability in real time by hybrid, field, or operation.
- Upload data from John Deere, Case IH, or Ag Leader seamlessly.
- Use satellite imagery, notes, and yield estimators to stay proactive.
- Optimize nitrogen applications with science-based crop models.
- Collaborate with advisors and teams using shared dashboards.
How much does Granular cost and is it worth it?
Granular offers a free Insights tier that covers field mapping, yield analysis, and basic profitability. Paid tiers like Platinum Plus add nitrogen modeling and advanced analytics.
For many farms, the ROI shows quickly. Even one informed decision on seed scripts or nitrogen use can offset subscription costs. One Iowa grower reported that cutting back on unnecessary nitrogen saved more than the annual subscription fee.
The software is scalable. You can start with free profitability tracking and add premium tools only when you’re ready. That flexibility makes it accessible whether you farm 500 acres or 5,000.
Why use Granular for farm planning?
- Tracks real-time field profitability.
- Supports crop planning across multiple varieties.
- Provides imagery, yield estimators, and nitrogen insights.
- Connects teams and advisors for unified decisions.
In Conclusion
Granular turns planning from guesswork into data-driven execution. You track costs, manage inputs, monitor profitability, and forecast yield—all in one place. By aligning agronomy with economics, you protect margins and push your fields toward maximum profitability season after season.